2.9 KiB
Create node groups
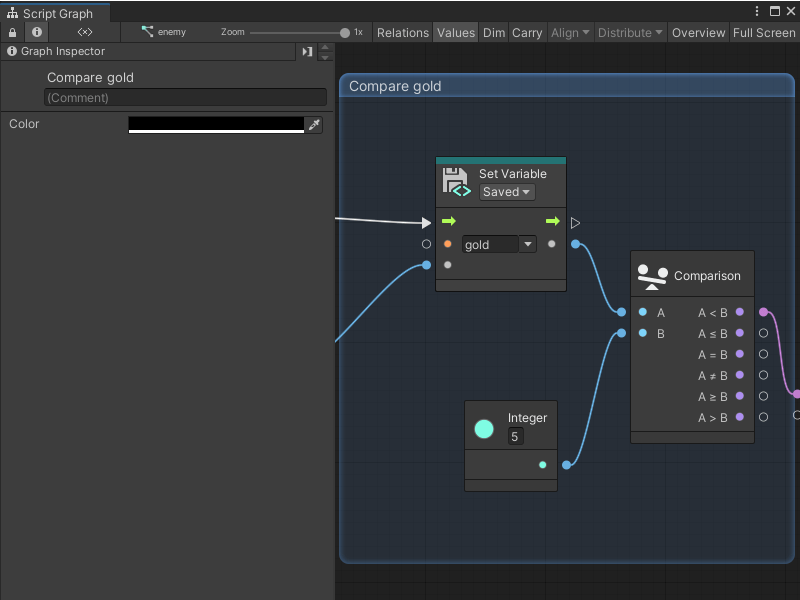
You can organize the nodes in your Script Graphs and State Graphs with node groups.
Create a new group
To create a new group:
-
Open the graph where you want to create a new group.
-
In an empty area of the Graph Editor, Ctrl+click (macOS: Cmd+click) and drag to create a selection.
-
Release the mouse to create the group.
After you create a group, you can:
- Change the group name
- Add a comment to the group
- Change the color of the group
- Resize the group
- Move the group
Change a group name
To change the name of the group in your graph:
-
In the group header, click Group.
-
Enter a new name for the group.
-
Press Enter to save your changes.
Add a comment to a group
To add a comment to a group in a graph:
-
Select the group where you want to add a comment.
-
Open the Graph Inspector.
-
In the (Comment) field in the Graph Inspector, enter comments or information about the group.
Note
Group comments are only visible in the Graph Inspector. To add comments to a graph that are always visible, use a Sticky Note.
Change the color of a group
To change the color of a group in a graph:
-
Select the group you want to edit.
-
Open the Graph Inspector.
-
In the Graph Inspector, select the Color field.
-
Select a new color for your group through one of the following methods:
- Use the color picker.
- Use the sliders or RGBA value fields.
- Enter a hexadecimal color value.
- Select the eyedropper icon and select a color from anywhere on your screen.
Resize a group
To resize a group in a graph:
- Click and drag from any edge or corner on the group.
Move a group
To move a group and its nodes:
- Click and drag the group's header to a new location in the Graph Editor.
Note
You can also move a group without moving any of the nodes inside, but the required input changes based on your chosen control scheme. For more information, see Choose a control scheme
Next steps
After you've created a node group, you can add nodes to your Script Graph, create and add variables, or add a Subgraph.
You can also add a Sticky Note to add comments to a graph.